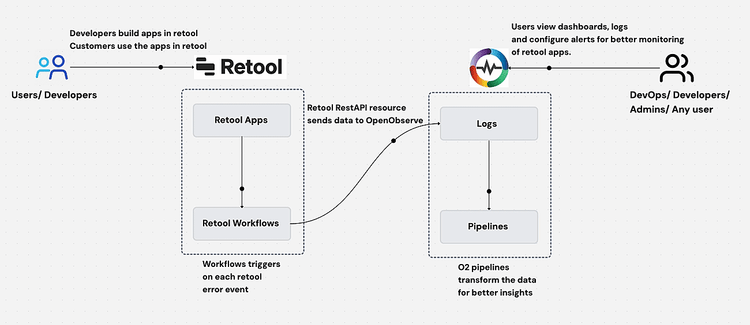
Complete Guide to Retool Enterprise Error Monitoring and Observability
Learn how to implement enterprise-grade error monitoring and observability for Retool applications. Compare native monitoring vs OpenObserve, setup workflows, configure dashboards, and establish best practices for tracking Retool app errors.
Complete Linux Monitoring with OpenObserve: Event Logs, Host Metrics, and More
Monitor Linux systems with OpenObserve. Learn how to collect and analyze system logs, metrics, and security events for improved system visibility, troubleshooting, and compliance. Get insights into performance monitoring and security with OpenObserve.
Understanding OpenObserve Pipelines: Real-Time Processing, Routing, and Pre-Aggregation
Discover how OpenObserve Pipelines enable real-time log processing, dynamic data routing, and pre-aggregation for optimized observability. Learn to transform raw logs into structured formats using VRL functions, efficiently route logs based on conditions, and pre-aggregate metrics to improve performance. This in-depth guide covers step-by-step implementation, from ingesting logs to building powerful OpenObserve Pipelines for seamless log management and analytics. Perfect for DevOps, SREs, and observability engineers looking to enhance log processing workflows.
LLM Observability for AI Applications with OpenObserve and OpenLIT
Discover how to integrate OpenObserve and OpenLIT for comprehensive LLM observability, enabling real-time monitoring, tracing, and optimization of AI application performance.
Uptime Monitoring Made Easy: SSL and URL Checks with OpenTelemetry
Learn how to ensure reliable uptime monitoring with SSL and URL checks. Discover the importance of proactive monitoring, set up OpenTelemetry Collector's HTTP Check Receiver and visualize data in OpenObserve dashboards for actionable insights.
A Complete Guide on How to Stream and Analyze AWS CloudWatch Logs Using Amazon Kinesis Firehose
Learn how to send AWS CloudWatch Logs to Amazon Kinesis Firehose with this step-by-step guide. Discover real-time log streaming, analysis techniques, and integration best practices to optimize cloud monitoring and performance.
Beginner’s Guide: How to Send AWS CloudWatch Logs to S3 via Kinesis Firehose
Learn how to send AWS CloudWatch logs to S3 using Kinesis Firehose in this beginner-friendly guide. Step-by-step instructions for seamless log streaming and storage
How to Monitor AWS Events Using Amazon EventBridge (CloudWatch Events)
Discover how to monitor AWS events using Amazon EventBridge and OpenObserve. Learn to set up a real-time event pipeline, simulate events, and create powerful visualizations for cloud environments.
A Comprehensive Guide to Distributed Tracing: From Basics to Beyond
Discover the essentials of distributed tracing, from core concepts to implementation. Learn how to visualize and analyze trace data, pinpoint bottlenecks, and optimize your microservices architecture with OpenObserve.
Mastering Windows IIS Logging: A Comprehensive Beginner's Guide
Learn everything about Windows IIS logging, from setup and configuration to log collection and parsing. Enhance your understanding and improve your IIS log management with step-by-step instructions and practical examples.
How to Monitor Nginx in Real-Time: Step-by-Step Guide for Tracking Logs, Metrics, and Performance Insights
Learn how to monitor Nginx logs in real-time with this step-by-step guide, covering essential techniques for tracking logs, metrics, and performance insights. Discover best practices to optimize Nginx performance, troubleshoot issues faster, and ensure high availability by gaining actionable visibility into your web server’s health.
Nginx Log Management: From Data Collection to Insightful Analysis
This blog guides you through effective Nginx log management and analysis using OpenObserve and Vector, providing insights on enhancing observability and streamlining your logging process.
Microservices Observability: Leveraging Logs, Metrics, and Traces for Enhanced System Performance
Discover how to implement effective microservices observability using logs, metrics, and traces. Learn key strategies to improve system performance, troubleshoot issues, and optimize your distributed architecture.
Choosing the Right SaaS Monitoring Solution: Features, Best Practices, and ROI
Discover how to choose the best SaaS monitoring solution for your organization. Learn key features, best practices, and ROI considerations in this comprehensive guide.
Complete Windows Monitoring with OpenObserve: Event Logs, Metrics, and More
Set up comprehensive Windows monitoring with OpenObserve. Collect, analyze, and visualize event logs, performance metrics, and security events for enhanced troubleshooting and system visibility.
How to Monitor Jenkins Pipelines with OpenTelemetry and OpenObserve
Learn how to monitor Jenkins pipelines effectively with this comprehensive guide on integrating OpenTelemetry and OpenObserve. Discover step-by-step instructions for capturing Jenkins logs, metrics, and traces to enhance CI/CD observability and optimize pipeline performance.