GCP Monitoring

Gain deep insights into your cloud infrastructure performance, troubleshoot issues efficiently, and optimize your operations.

GCP Monitoring

Why Use OpenObserve for GCP Monitoring?

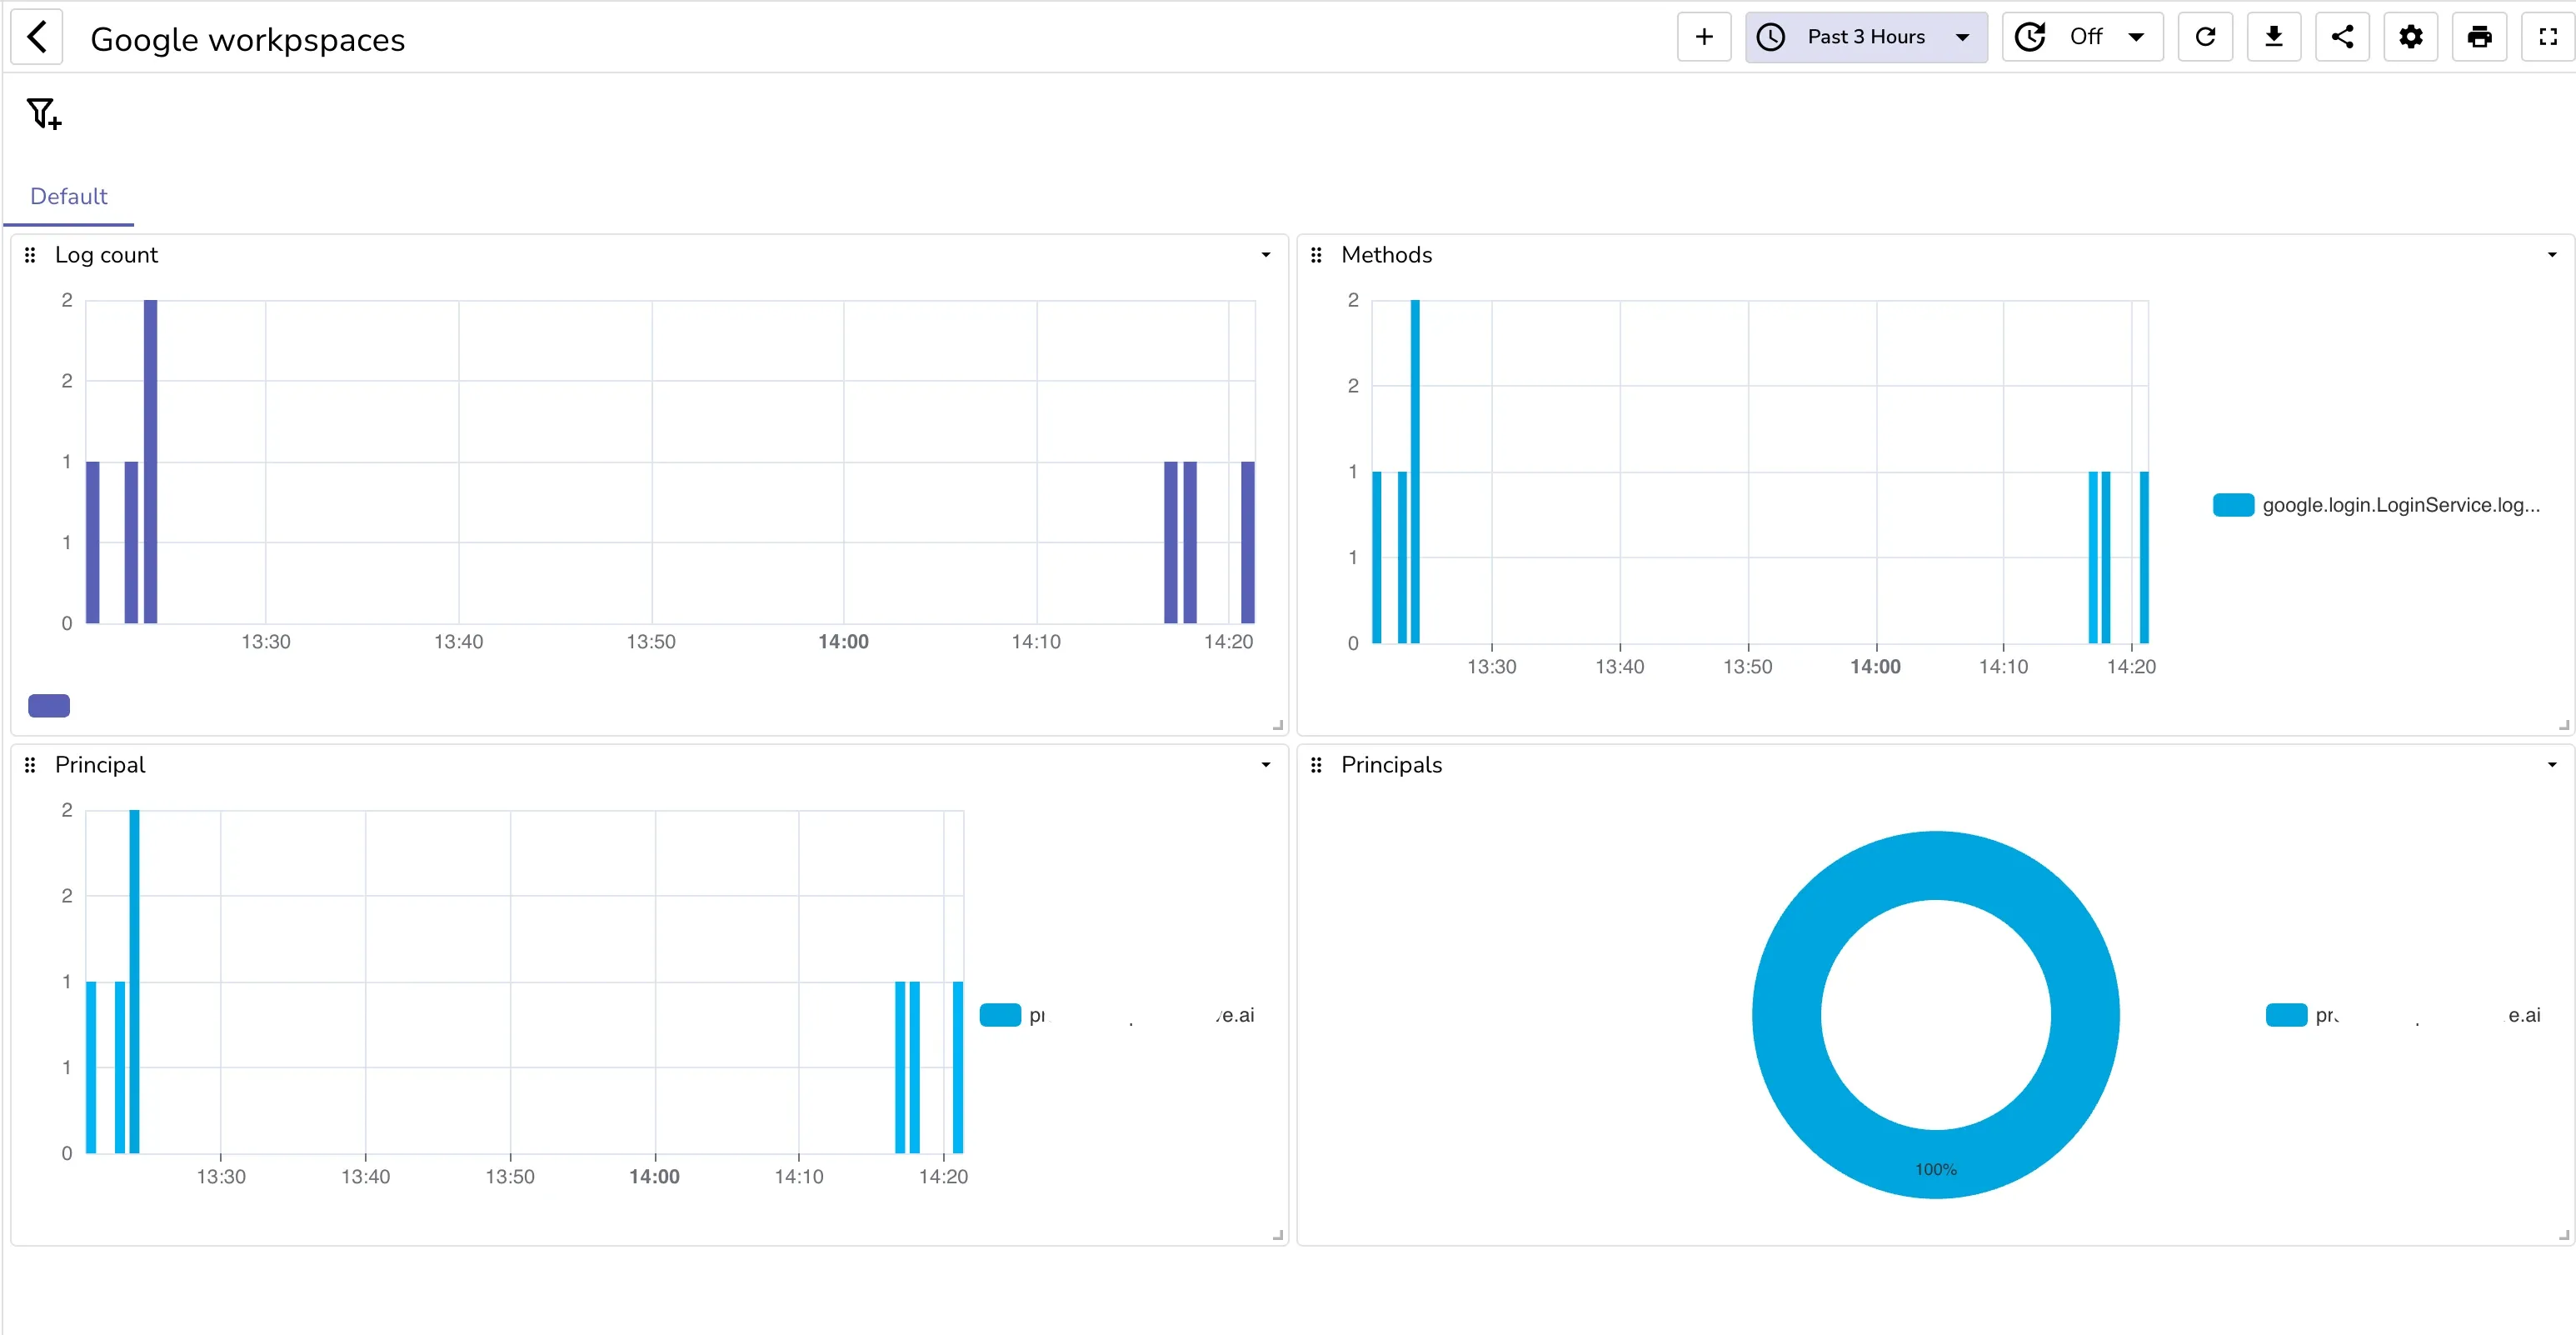
Deep GCP Observability

Gain deep visibility into the many layers of your GCP environment for faster troubleshooting and proactive issue prevention.

Telemetry Cost Optimization

Slash GCP telemetry storage costs with OpenObserve’s efficient compression and retention.

Almost Too-easy Integration

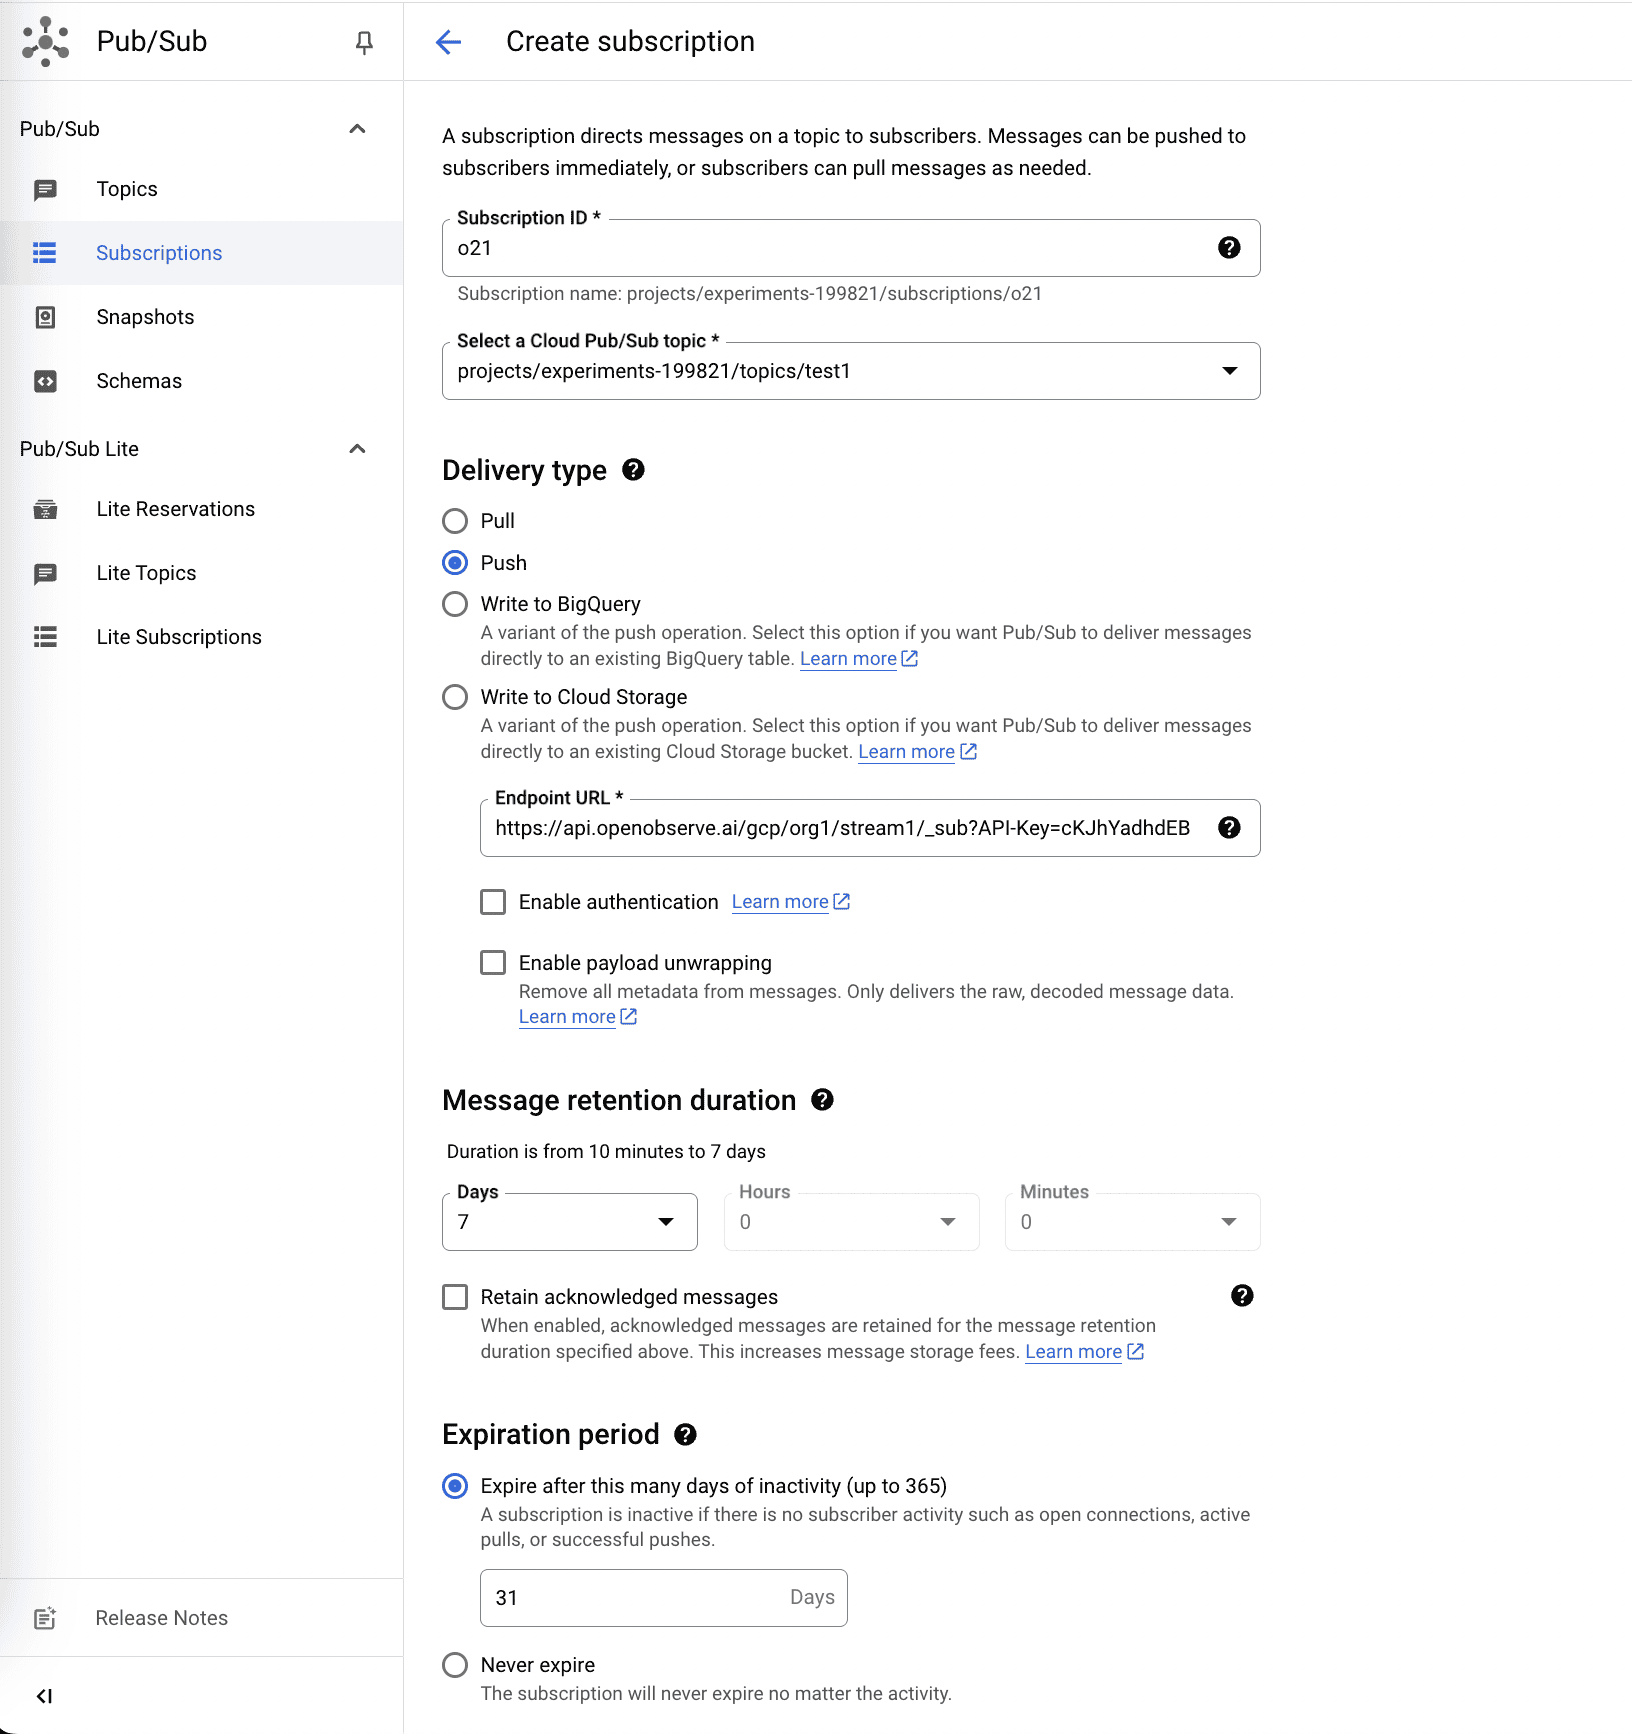
Easy setup with the Cloud Logging export to Pub/Sub or OpenTelemetry collector with Terraform support for efficient telemetry collection.

OpenObserve’s Key GCP Monitoring Capabilities

Data Collection and Analysis

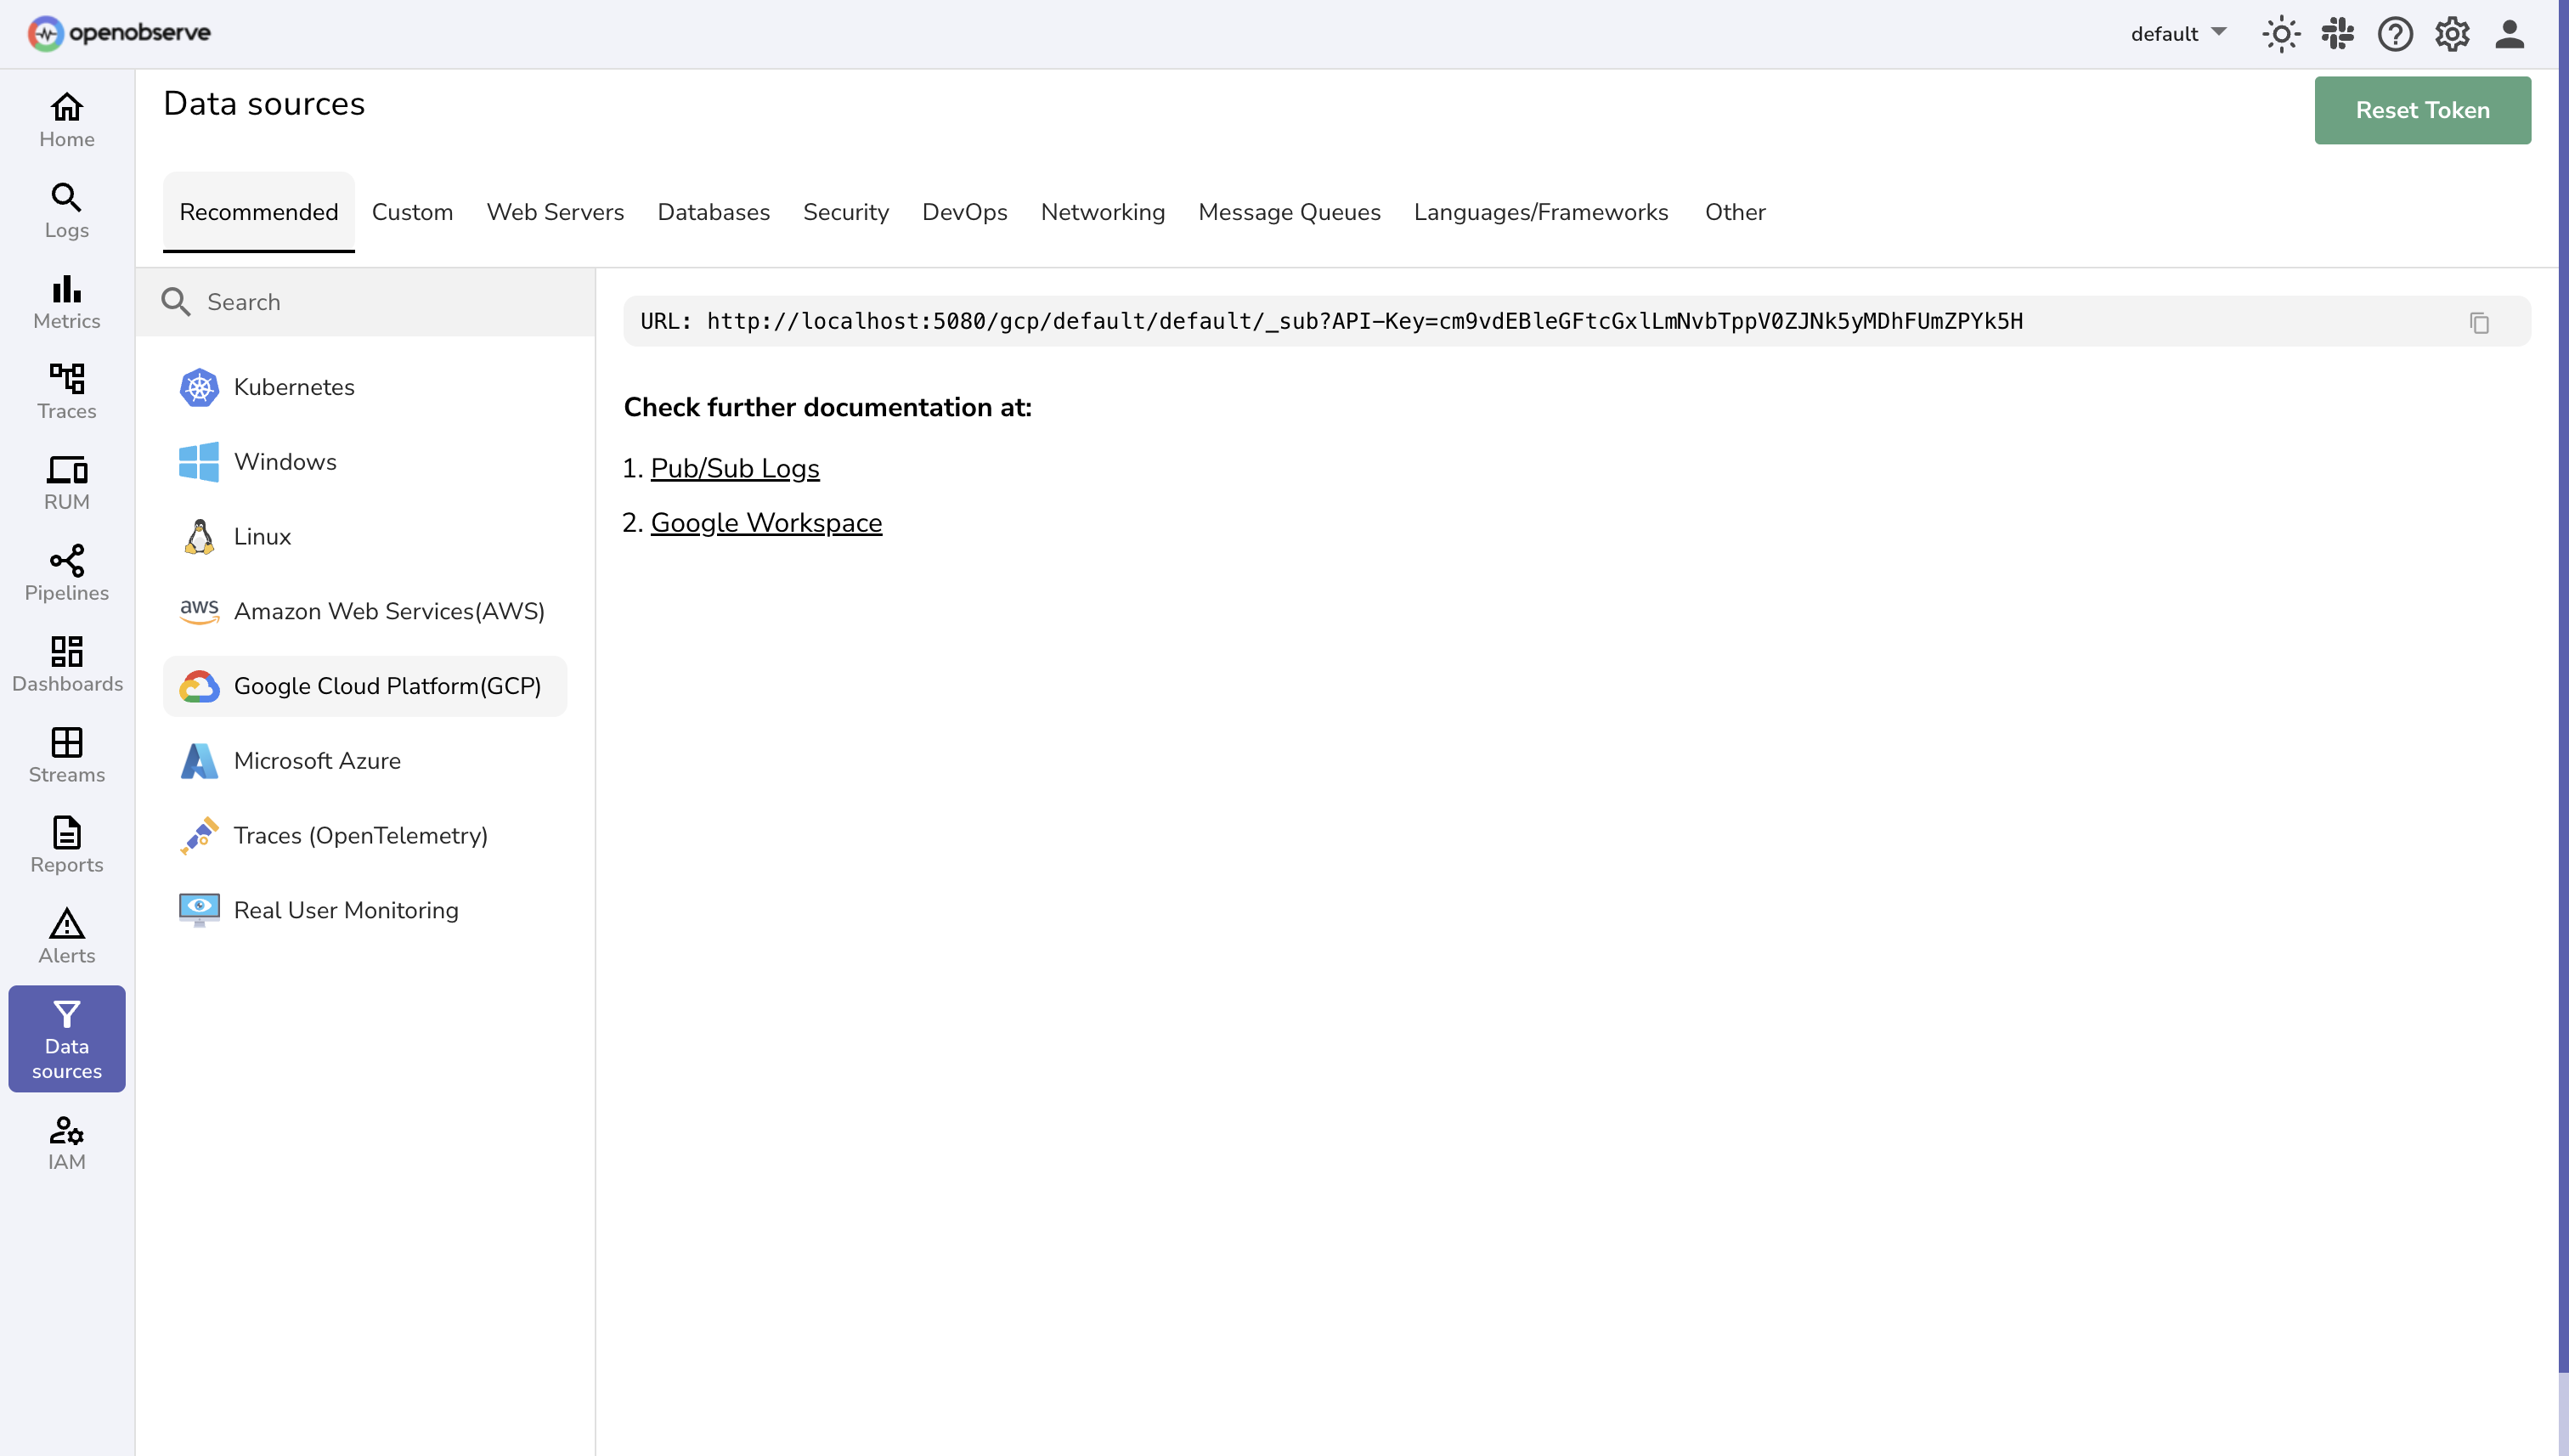
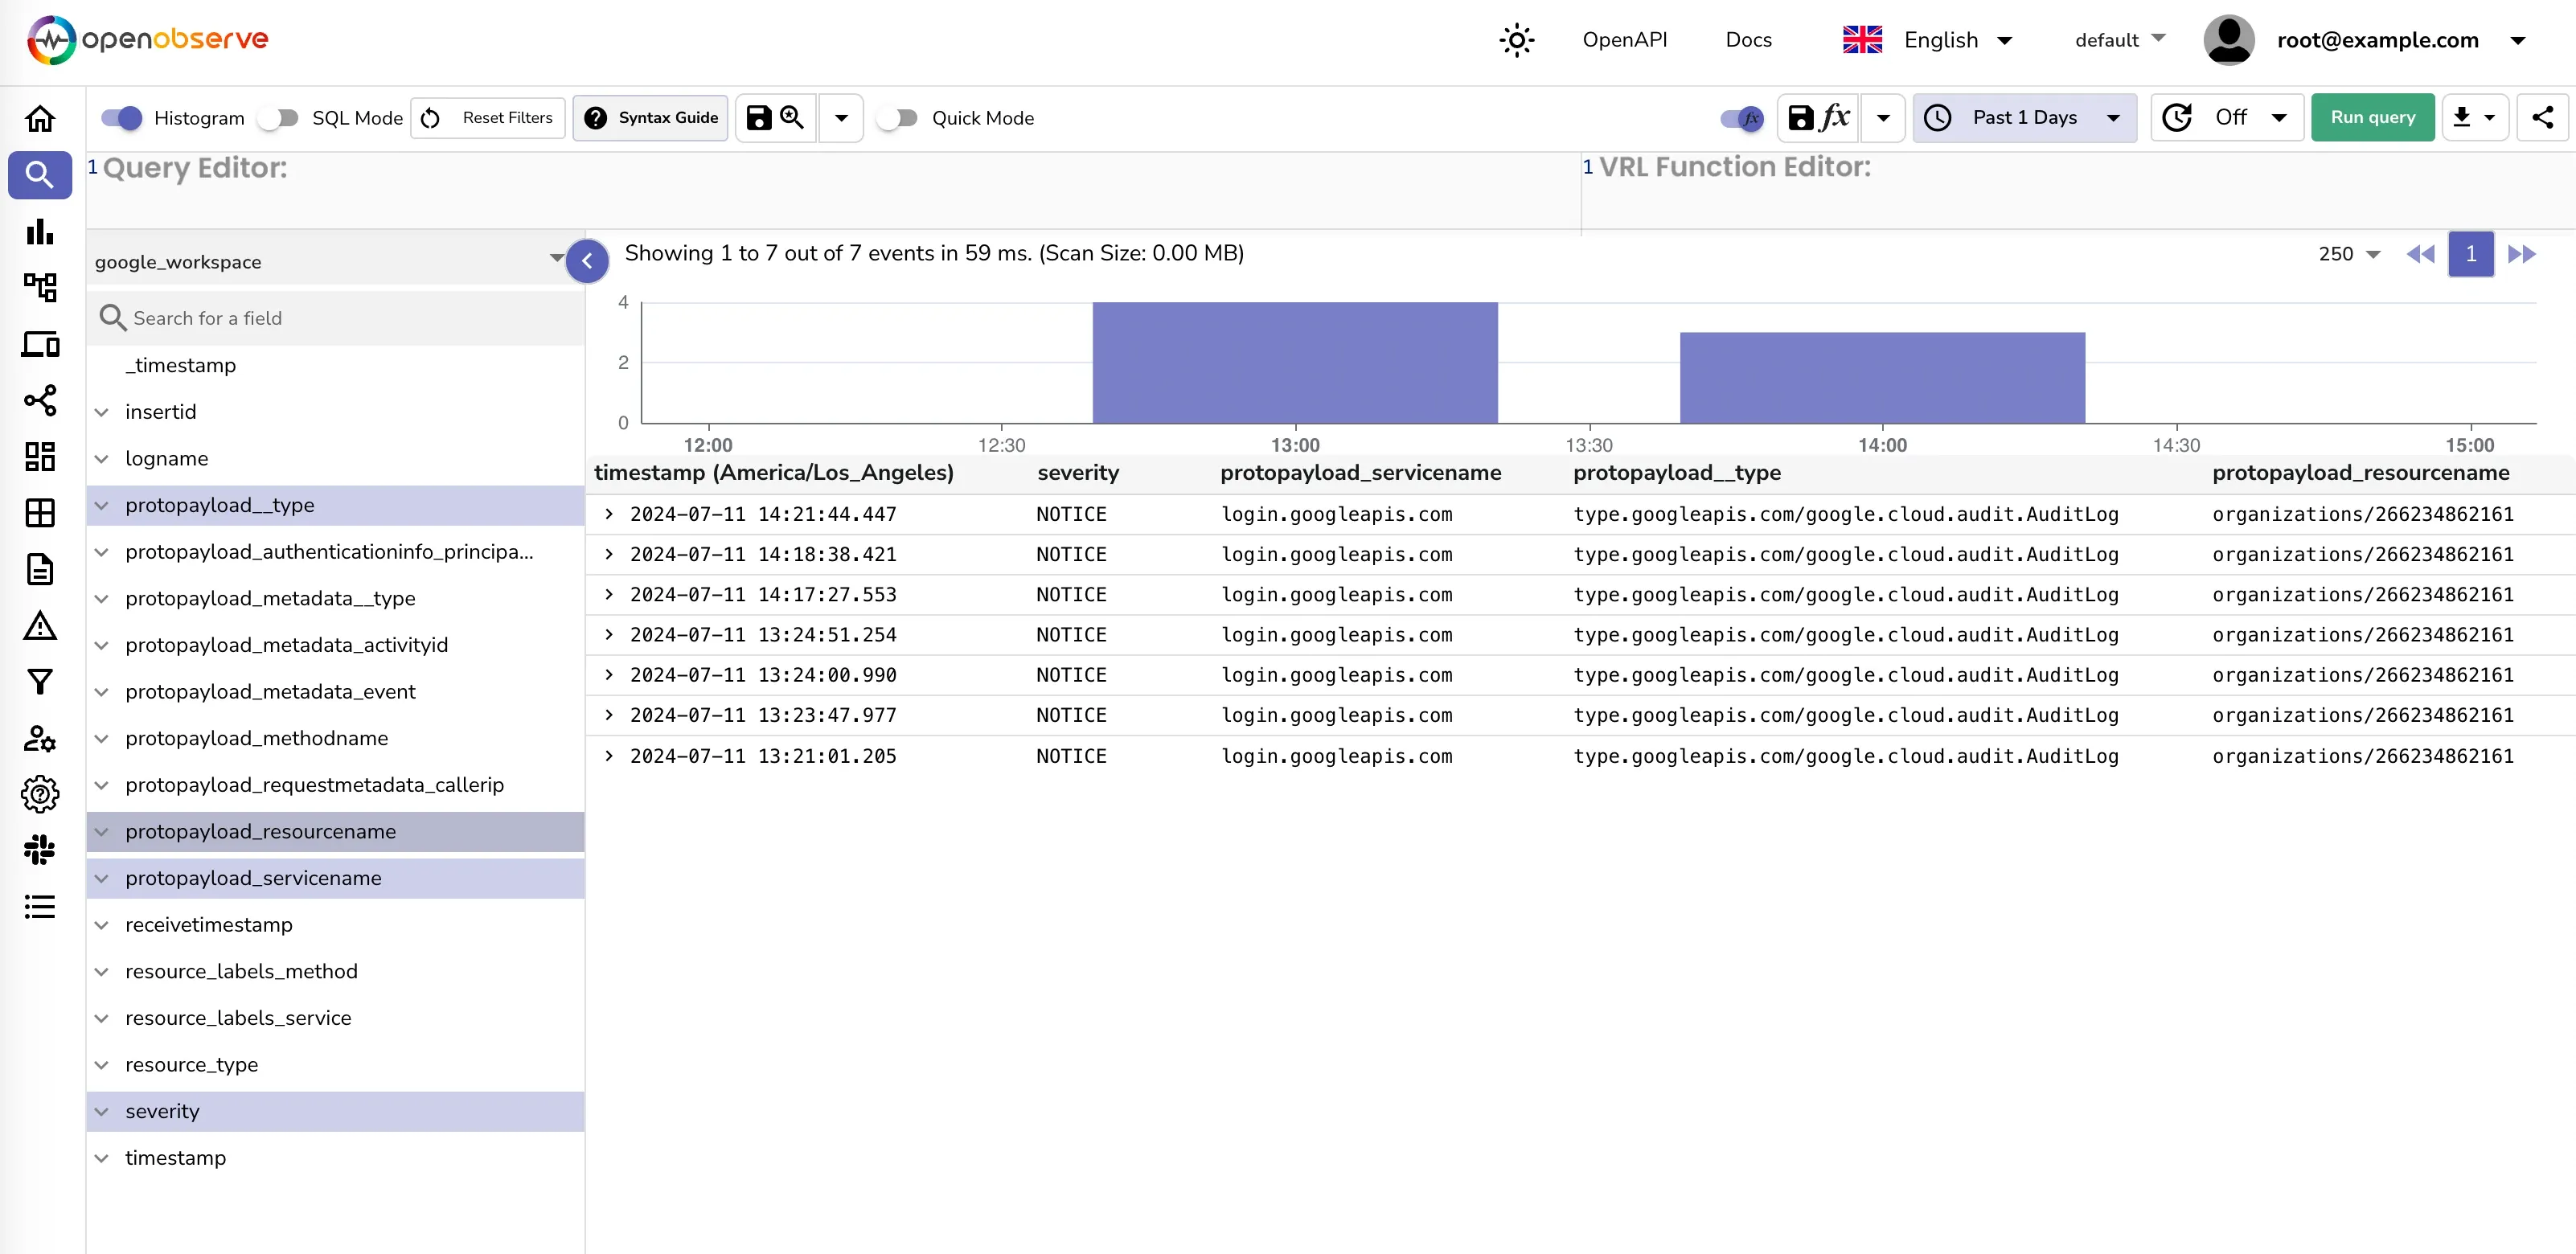
  • Cloud Logging Integration

    Unify your GCP logs through a single pipeline. Export logs seamlessly from Cloud Logging to Pub/Sub, capturing everything from audit trails to VPC flows to application events in a single, centralized stream.

  • Metric Collection

    Gain complete visibility into your GCP performance. Collect both platform metrics and custom application telemetry through Cloud Monitoring export for comprehensive performance insights.

Data Collection and Analysis

Service Monitoring

  • Core Services

    Keep your essential GCP services running flawlessly. Monitor Compute Engine, Cloud Run, Cloud Functions, and Cloud SQL with purpose-built dashboards that reveal performance in real time.

  • Infrastructure Insights

    See your entire GCP ecosystem at work. Track resource utilization, performance trends, and service health with instant visibility that helps you prevent problems before they start.

Service Monitoring

Log Processing

  • Structured Analysis

    Extract meaning from mountains of log data. Parse GCP logs efficiently with specialized processors optimized for Google Cloud formats and your custom log structures.

  • SQL Analytics

    Ask complex questions, get immediate answers. Query logs and metrics using familiar SQL syntax with full support for advanced aggregations and time-series analysis.

Log Processing

Resource Management

  • Performance Tracking

    Optimize your compute resources with precision. Monitor detailed service metrics that drive smarter capacity planning and resource allocation decisions.

  • Storage Optimization

    Keep what matters, discard what doesn't. Configure intelligent retention policies and compression settings that balance cost efficiency with ready access to your most important data.

Resource Management

GCP Monitoring FAQs

Latest From Our Blogs

 Complete Guide to Retool Enterprise Error Monitoring and Observability
Engineering

Complete Guide to Retool Enterprise Error Monitoring and Observability

Learn how to implement enterprise-grade error monitoring and observability for Retool applications. Compare native monitoring vs OpenObserve, setup workflows, configure dashboards, and establish best practices for tracking Retool app errors.

Chaitanya Sistla
Chaitanya Sistla
2025-05-14
How to Deploy OpenObserve on Heroku: A Complete Guide
How to

How to Deploy OpenObserve on Heroku: A Complete Guide

Deploy OpenObserve on Heroku without DevOps complexity. Get logs, metrics, and traces monitoring running in minutes with our comprehensive deployment guide.

Chaitanya Sistla
Chaitanya Sistla
2025-05-14
Complete Fortinet Firewall Monitoring Guide: Log Analysis
Engineering

Complete Fortinet Firewall Monitoring Guide: Log Analysis

Learn how to monitor Fortinet firewalls using OpenObserve. Step-by-step guide for syslog setup, log transformation, and creating dashboards for real-time security monitoring.

Chaitanya Sistla
Chaitanya Sistla
2025-05-11
Token Exchange & OpenObserve Service accounts
Engineering

Token Exchange & OpenObserve Service accounts

Discover OpenObserve’s Service Accounts feature, designed for secure programmatic access to APIs. Learn how token exchange enhances security and simplifies automation.

Manas Sharma
Manas Sharma
2025-05-05
OpenObserve Reaches 15,000 GitHub Stars: A Journey to Provide Simple, Efficient, and Performant Observability for All
Announcement

OpenObserve Reaches 15,000 GitHub Stars: A Journey to Provide Simple, Efficient, and Performant Observability for All

OpenObserve has just surpassed 15,000 stars on GitHub, a milestone that fills me with both pride and gratitude. When we started this project three years ago, the goal was simple yet ambitious: to build an open-source observability platform that is easier, faster, and dramatically more cost-effective than anything out there.

Prabhat Sharma
Prabhat Sharma
2025-04-28
How to Configure Microsoft ADDS LDAP with OpenObserve and Dex: Complete Integration Guide
How to

How to Configure Microsoft ADDS LDAP with OpenObserve and Dex: Complete Integration Guide

Learn how to securely integrate Microsoft Active Directory Domain Services (ADDS) LDAP with OpenObserve and Dex. This step-by-step guide covers authentication configuration, troubleshooting tips, and best practices for enterprise observability solutions.

Chaitanya Sistla
Chaitanya Sistla
2025-04-23
Monitoring Java GC Logs: Enhance Application Performance with OpenObserve
Engineering

Monitoring Java GC Logs: Enhance Application Performance with OpenObserve

Learn how to leverage Java GC logs to diagnose memory issues, optimize application performance, and prevent production outages. This guide explains how to interpret GC log patterns and use OpenObserve for practical monitoring and analysis.

Manas Sharma
Manas Sharma
2025-04-18
What is SNMP Monitoring? OpenTelemetry and OpenObserve Guide
Engineering

What is SNMP Monitoring? OpenTelemetry and OpenObserve Guide

Learn how to implement effective SNMP monitoring using OpenTelemetry and OpenObserve. Monitor network devices, servers, and infrastructure with real-time insights and improved troubleshooting.

Manas Sharma
Manas Sharma
2025-04-15
Monitoring ArgoCD Deployments with Prometheus and OpenObserve
How to

Monitoring ArgoCD Deployments with Prometheus and OpenObserve

Unlock the full potential of your ArgoCD deployments with Prometheus and OpenObserve monitoring. Get real-time insights into application health, sync status, and reconciliation performance.

Manas Sharma
Manas Sharma
2025-04-10
Complete Linux Monitoring with OpenObserve: Event Logs, Host Metrics, and More
Engineering

Complete Linux Monitoring with OpenObserve: Event Logs, Host Metrics, and More

Monitor Linux systems with OpenObserve. Learn how to collect and analyze system logs, metrics, and security events for improved system visibility, troubleshooting, and compliance. Get insights into performance monitoring and security with OpenObserve.

Manas Sharma
Manas Sharma
2025-04-08

Ready to get started?

Try OpenObserve today for more efficient and performant observability.