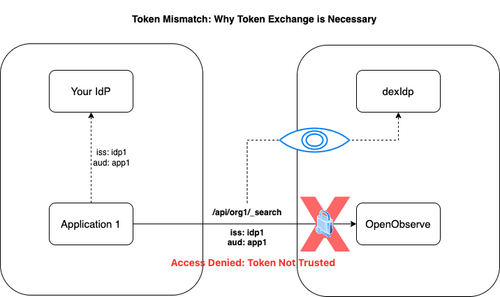
Discover OpenObserve’s Service Accounts feature, designed for secure programmatic access to APIs. Learn how token exchange enhances security and simplifies automation.
Monitoring Java GC Logs: Enhance Application Performance with OpenObserve
Learn how to leverage Java GC logs to diagnose memory issues, optimize application performance, and prevent production outages. This guide explains how to interpret GC log patterns and use OpenObserve for practical monitoring and analysis.
What is SNMP Monitoring? OpenTelemetry and OpenObserve Guide
Learn how to implement effective SNMP monitoring using OpenTelemetry and OpenObserve. Monitor network devices, servers, and infrastructure with real-time insights and improved troubleshooting.
Monitoring ArgoCD Deployments with Prometheus and OpenObserve
Unlock the full potential of your ArgoCD deployments with Prometheus and OpenObserve monitoring. Get real-time insights into application health, sync status, and reconciliation performance.
Complete Linux Monitoring with OpenObserve: Event Logs, Host Metrics, and More
Monitor Linux systems with OpenObserve. Learn how to collect and analyze system logs, metrics, and security events for improved system visibility, troubleshooting, and compliance. Get insights into performance monitoring and security with OpenObserve.
Monitoring EKS Fargate Logs with Fluent Bit and OpenObserve
Learn how to capture and analyze Amazon EKS Fargate logs using AWS's built-in Fluent Bit log router, Kinesis Firehose, and OpenObserve for comprehensive container monitoring.
How to Configure PagerDuty with OpenObserve Alerts: A Step-by-Step Guide
This comprehensive guide walks you through the process of integrating PagerDuty with OpenObserve for effective incident management. You'll learn how to set up a PagerDuty service, create alert templates in OpenObserve, configure webhook destinations, and test your integration. Perfect for DevOps engineers, SREs, and IT professionals looking to streamline their alerting workflow and improve response times to critical issues.
Learn how to configure Datadog Agent to send metrics to OpenObserve using OpenTelemetry Collector. Complete guide with setup, troubleshooting & best practices.
Distributed Tracing in .NET Applications using OpenTelemetry
Learn how to implement distributed tracing in your .NET applications using OpenTelemetry. This guide covers the benefits of distributed tracing, how to get started with OpenTelemetry, and best practices for implementation.
Distributed Tracing in Node.js Applications with OpenTelemetry
Learn how to implement distributed tracing in your Node.js applications using OpenTelemetry. Complete guide covering auto & manual instrumentation, trace visualization, and monitoring with OpenObserve.
LLM Observability for AI Applications with OpenObserve and OpenLIT
Discover how to integrate OpenObserve and OpenLIT for comprehensive LLM observability, enabling real-time monitoring, tracing, and optimization of AI application performance.
Simplifying Kubernetes Monitoring with OpenTelemetry and OpenObserve
Discover how Opentelemetry & OpenObserve simplifies Kubernetes monitoring. Enhance visibility, performance, and troubleshooting for your Kubernetes Enviornment.
Monitor Your PostgreSQL Performance via OpenTelemetry Collector
Monitor PostgreSQL like a pro! Use OpenTelemetry and Openobserve for clear insights into performance metrics. Begin your journey to better monitoring today!
How to Monitor AWS API Gateway Access Logs via Kinesis Data Firehose and Openobserve
Discover the importance of log monitoring for API performance, step-by-step instructions on setting up a Lambda function, creating a REST API, and configuring Kinesis Firehose for seamless log streaming.
Enhancing Kubernetes Metrics Collection With Opentelemetry and Prometheus
Enhance your Kubernetes observability using OpenTelemetry and Prometheus. TargetAllocator optimizes target discovery, ensuring reliable monitoring in dynamic settings.